
24HourCharts
6.6 / 10
1,033ms
100%
N/A
Generate Charts as SVG, PNG or HTML
24HourCharts API makes it easy to convert data points into a chart.
The following example creates the chart 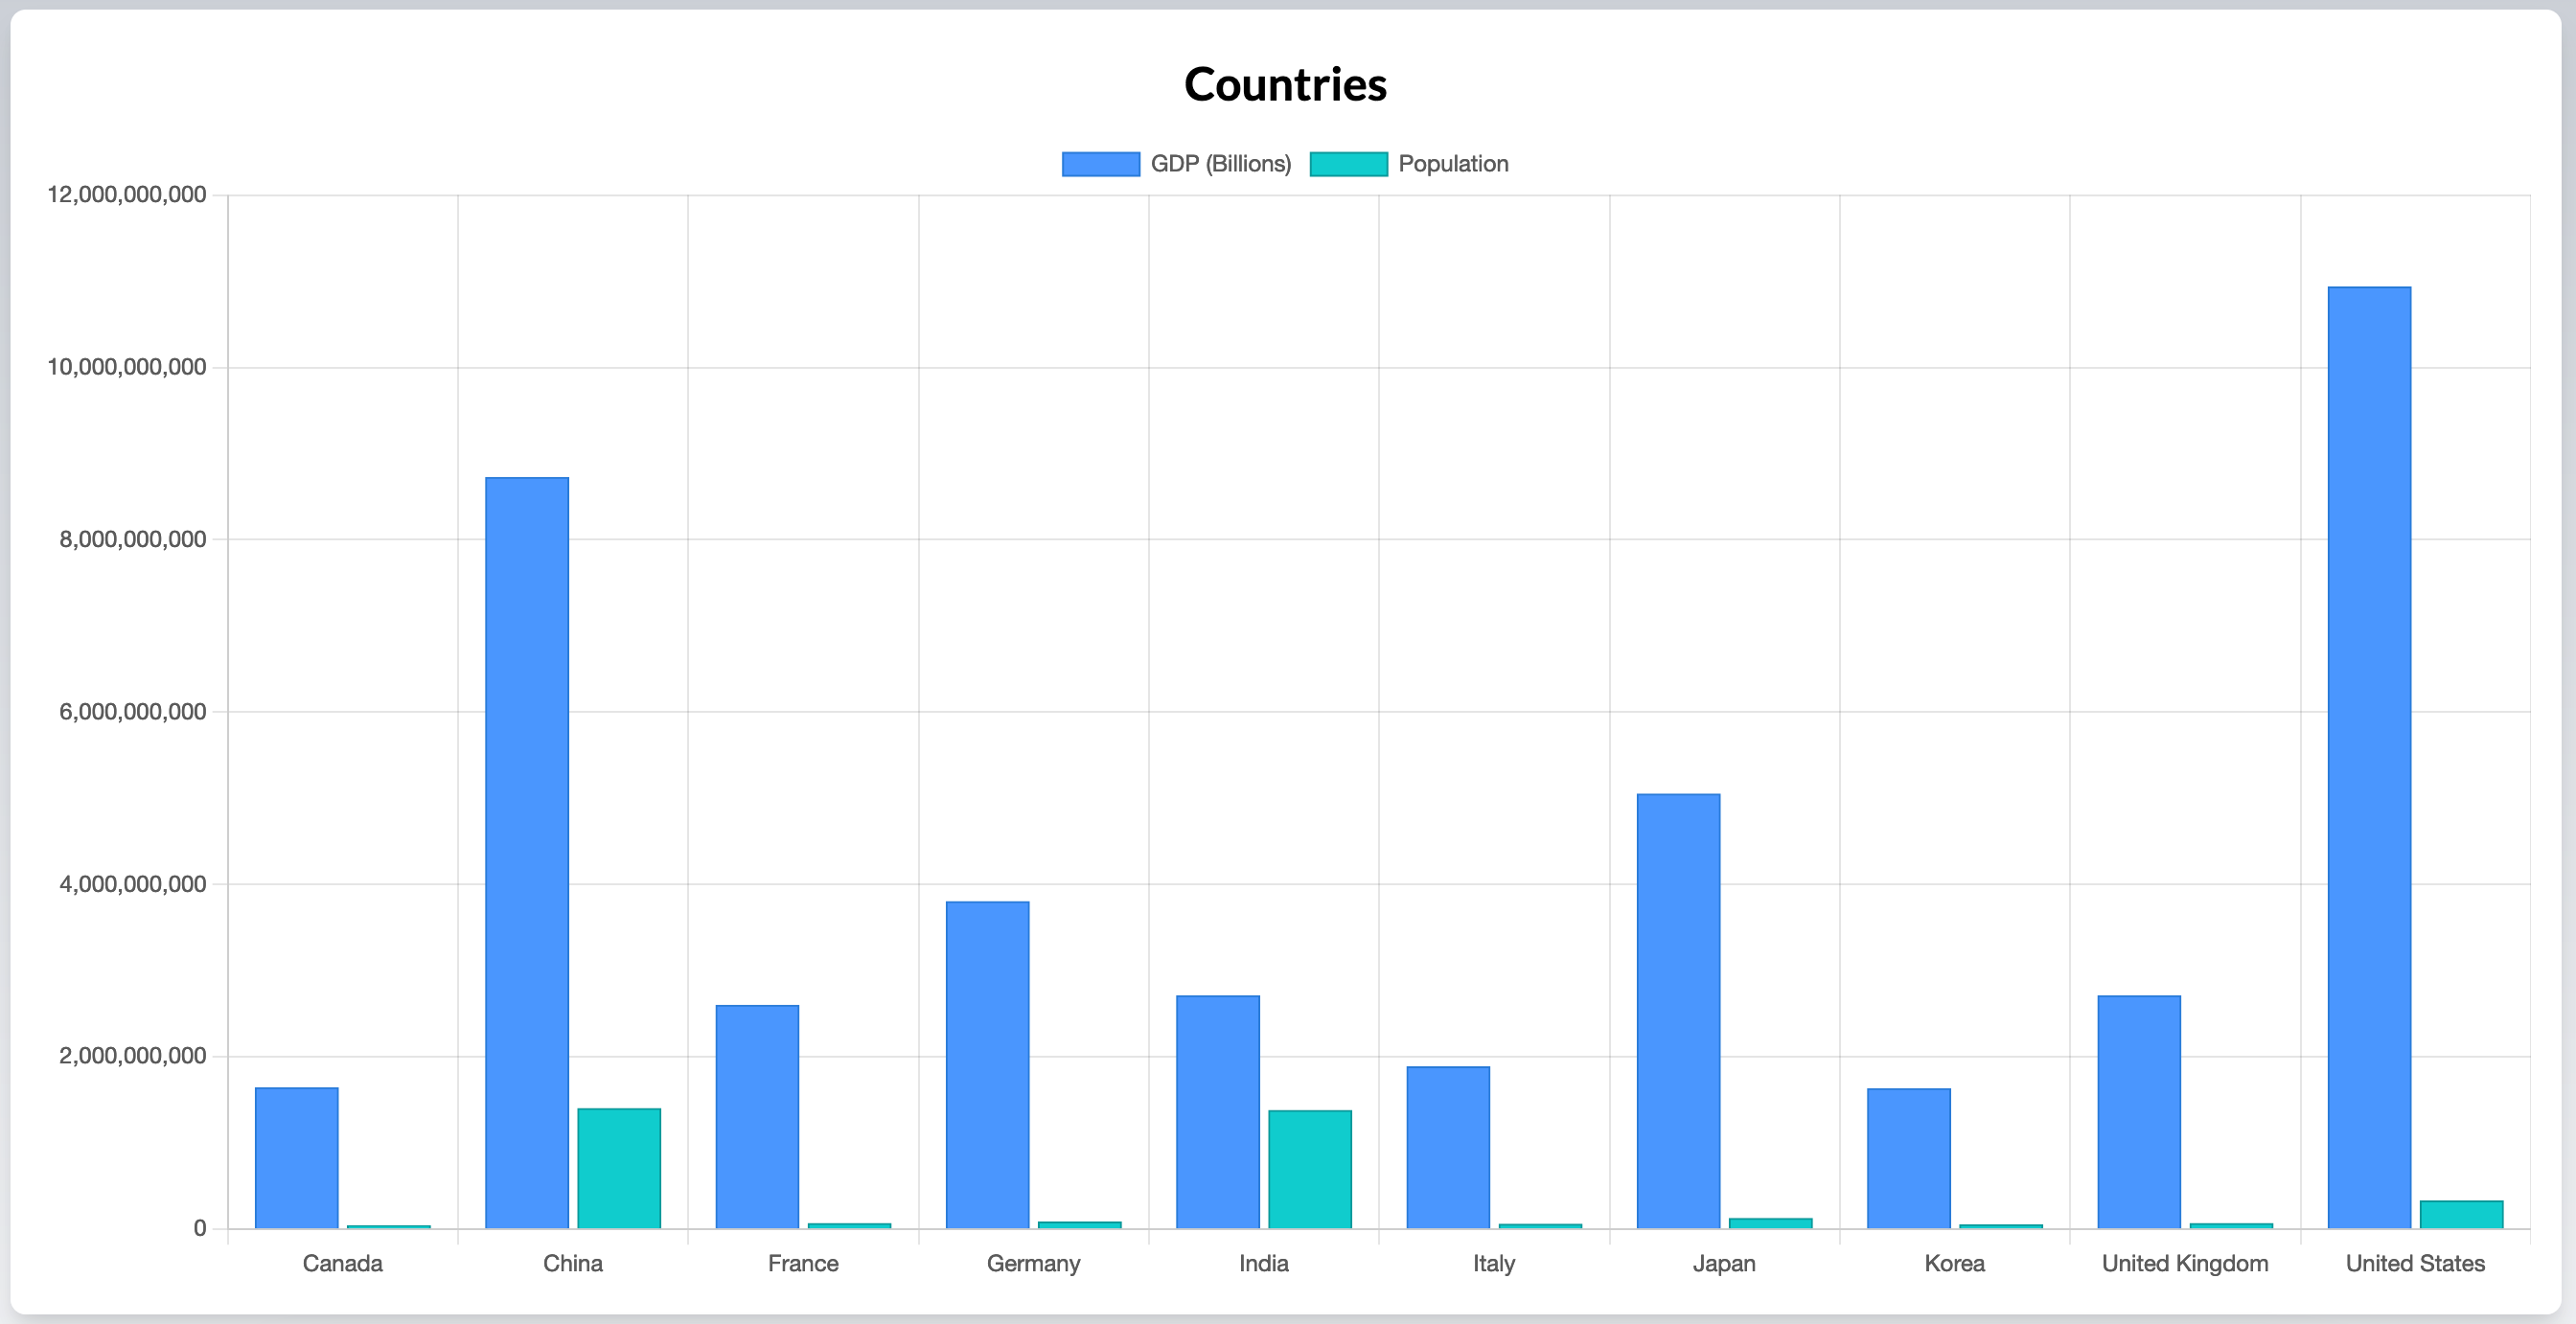
24HourCharts API supports the following chart type:
- bar
- horizontalbar
- line
- pie
- stackedbar
- stackedhorizontalbar
- stackedLine
Using the following JavaScript data body object.
let data = {
type: “bar”,
title: “Example Chart”,
xlabel:“Type”,
ylabel:“Total”,
showLegend:true,
“labels”: [“Canada”,“China”,“France”,“Germany”,“India”,“Italy”,“Japan”,“Korea”,“United Kingdom”,“United States”],
“datasets”: [
{
“label”: “GDP (Billions)”,
“values”: [
"$1,643,410,000.00","$8,722,840,000.00","$2,598,910,000.00","$3,803,010,000.00","$2,708,770,000.00","$1,884,940,000.00","$5,048,690,000.00","$1,630,870,000.00","$2,710,970,000.00","$10,932,750,000.00"
]
},
{
“label”: “Population”,
“values”: [
“38,005,238”,“1,402,112,000”,“67,391,582”,“83,240,525”,“1,380,004,385”,“59,554,023”,“125,836,021”,“51,780,579”,“67,215,293”,“329,484,123”
]
}
]
}
Sending a POST request to
- https://24hourcharts.p.rapidapi.com/v1/charts/png’ -> Generates an PNG image
- https://24hourcharts.p.rapidapi.com/v1/charts/svg -> Generates an SVG image
- https://24hourcharts.p.rapidapi.com/v1/charts/png’ -> Generate an HTML page that contains the chart.
fetch(‘https://24hourcharts.p.rapidapi.com/v1/charts/png’, {
method: “POST”,
body: JSON.stringify(data),
headers: {
“Content-type”: “application/json; charset=UTF-8”,
“x-rapidapi-host”: “24hourcharts.p.rapidapi.com”,
“x-rapidapi-key”: “YourApiKeyHere”
}
})